Data Analysis and Probability Online Resources
THE STANDARDS (NCTM - PSSM)
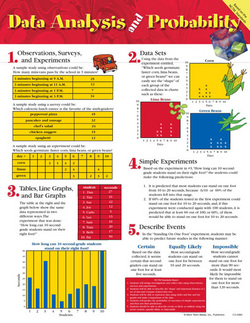
Formulate questions that can be addressed with data and collect, organize, and display relevant data to answer them:
Formulate questions that can be addressed with data and collect, organize, and display relevant data to answer them:
- formulate questions, design studies, and collect data about a characteristic shared by two populations or different characteristics within one population;
- select, create, and use appropriate graphical representations of data, including histograms, box plots, and scatterplots.
- find, use, and interpret measures of center and spread, including mean and interquartile range;
- discuss and understand the correspondence between data sets and their graphical representations, especially histograms, stem-and-leaf plots, box plots, and scatterplots.
- use observations about differences between two or more samples to make conjectures about the populations from which the samples were taken;
- make conjectures about possible relationships between two characteristics of a sample on the basis of scatterplots of the data and approximate lines of fit;
- use conjectures to formulate new questions and plan new studies to answer them.
- understand and use appropriate terminology to describe complementary and mutually exclusive events;
- use proportionality and a basic understanding of probability to make and test conjectures about the results of experiments and simulations;
- compute probabilities for simple compound events, using such methods as organized lists, tree diagrams, and area models.
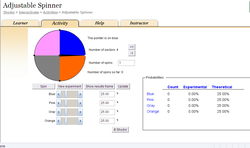
ADJUSTABLE SPINNER
Click on image!
This applet provides students a colored spinner to practice probability. The number of sectors and percentages can be adjusted for the spinner and this gives the students the opportunity to see the relationship with fractions and percentages. Students can then spin the spinner and compare the experimental and theoretical outcomes for their spinner they have created.
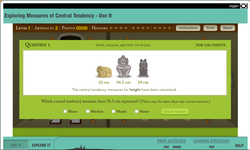
EXPLORING MEASURES OF CENTRAL TENDENCY
Click on image!
This interactive mathematics resource allows students to explore and interpret the mean, median and mode of a created data set. The resource includes print activities, solutions, learning strategies, and an Aztec museum game. Instructions are provided on how to move around in rooms to collect artifacts that are used to generate data (mean, median, mode) and questions related to the artifacts are presented for students to answer.
